

What is a p-diagram?
A p-diagram (parameter diagram) is a tool used at the initial stage of D-FMEA analysis to better understand how a function is performed.
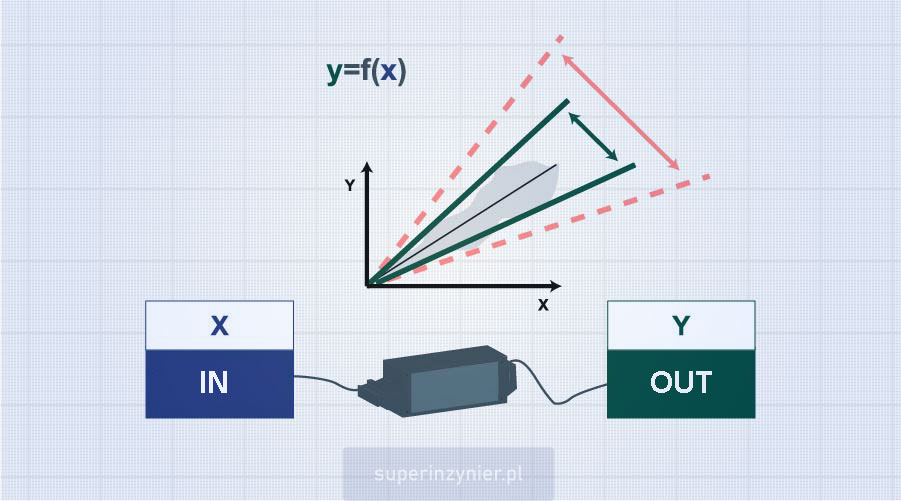
The function realized by an object is, in a sense, the conversion of "input" (x) into "output" (y). Thus, we can say that the realized function can be defined by the general formula: "y=f(x)". For example: a switching power supply converts an input voltage of 230Vac into an output voltage of 12Vdc.
During the execution of the function, there are various "side effects" such as heat generation, noise, smell, electromagnetic emission, etc.
In addition, if the function is not performed correctly and the result is "beyond the expected results", we will refer to such a situation as an "error condition", which will quite often be understood as a failure mode (failure to fulfill the function) and sometimes as the effect of a failure mode (failure to fulfill a higher-level function in the product structure).
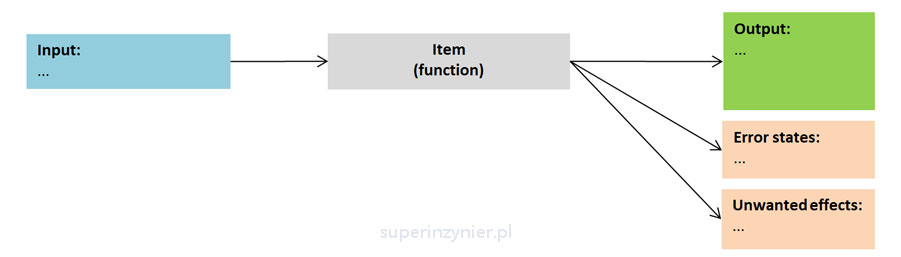
We start the P-diagram by defining the object: the analyzed system/subsystem/component and its functions. Then we define inputs, outputs, error states and unwanted effects.
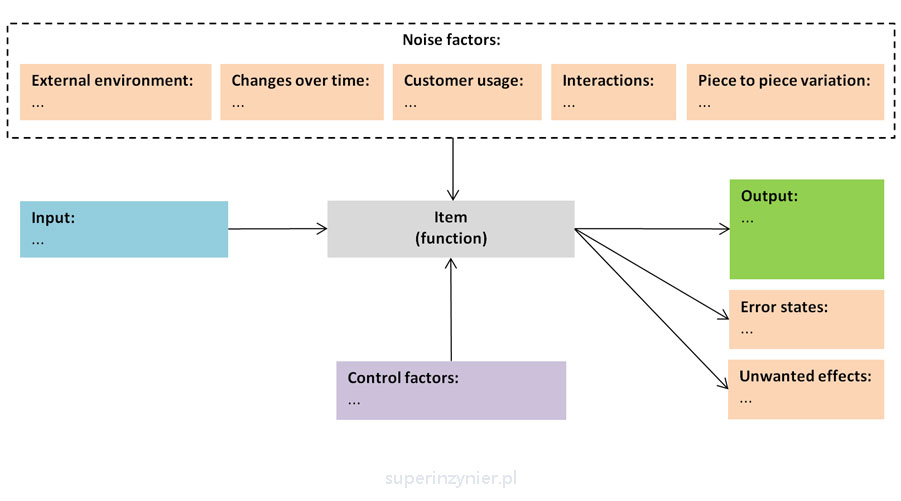
The realization of a given function is "affected" by various noise factors, which we can break down into several aspects:
- External environment.
- Changes over time.
- Customer usage.
- System interactions.
- Piece to piece variation.
We also identify "control factors", i.e. characteristics/features of the designed part that we can change to ensure that the function is carried out correctly despite the presence of noise factors.
We can represent the complete picture in the form of the following graph:
Benefits of p-diagram
The p-diagram allows the D-FMEA team to better understand what parameters/factors affect the correct execution of the function.
With a p-diagram, we can select controllable factors in such a way that the function is reliably executed despite hindrance from interfering factors.
The p-diagram also allows us to improve prototype testing (DVP), which was actually the original reason for developing this tool many years ago..
Tools
All you need is a spreadsheet and a good, detailed discussion within the D-FMEA team :).
Several FMEA software vendors have added support for developing a p-diagram and linking the information to the D-FMEA analysis.
Note that there are several techniques for developing a p-diagram depending on the standards used and the requirements of the organization.
Summary
P-diagram is a useful technique in design and can significantly improve the reliability of a product and its robustness. I recommend its use.
Currently, the p-diagram is mentioned in some FMEA standards such as AIAG FMEA-4, AIAG-VDA FMEA, Ford FMEA and SAE J-1739. The various standards contain a rather laconic description of this technique and, unfortunately, there are slight differences in the approach and appearance of the p-diagram. The overall meaning, however, remains the same.
