

Control chart
The control chart is one of the seven basic quality tools, very popular in various industries, but sometimes used incorrectly.
The control chart helps to control the process, i.e. to monitor a given characteristic (product feature or process parameter) and detect disturbances that require urgent action, while not acting upon the normal causes of variation.
The history of control charts dates back to the 1920s, when Walter A. Shewhart, an engineer at Bell Telephone Laboratories, introduced the basic concepts and developed the first control charts. To this day, one can still encounter the term "Shewhart control charts", a reference to their creator.
Control charts are part of a wider concept called Statistical Process Control (SPC).
Control chart structure
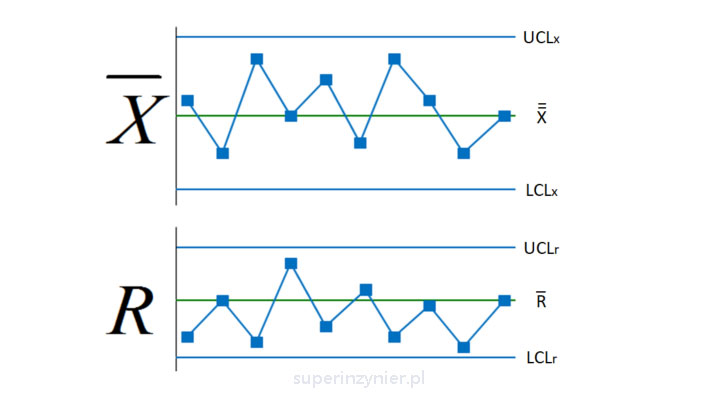
The structure of the control chart depends on the type chosen. The following example shows the most common chart named "X-R".
- This chart has two tracks of data. The first track "X" represents the average value from the sample results and the second track "R" is the range, which is the difference between the maximum and minimum values of the samples.
- The green lines are averages of the displayed data in each track.
- The UCL line is the upper control limit and the LCL line is the lower control limit. The limits are calculated according to specific formulas, for both tracks separately.
- The data results (average and range) are plotted on a graph in the form of dots connected by a line.
Causes of variability
Understanding the meaning of the control chart requires first discussing what is variability in the process.
Many industrial processes will not operate consistently when adjustments are made to them over and over again. This is especially true of metallurgical and chemical processes, e.g. soldering, coating, potting, casting, welding, heat treatment, electroplating, etc. In such processes, parameters should not be adjusted every time we see some variation in the results. However, if we react to every fluctuation, we will end up deregulating the process and leading to much higher losses.
Every process is characterized by a certain amount of variability, which is related to the random occurrence of various normal causes and serious distortions that are the result of special causes. Therefore, it is important to respond only to those problems that actually matter.
Special causes
This types of causes lead to process disruptions that should be resolved as soon as possible by those closest to the process, i.e., operators, setters or process engineers. For example, a special cause is a dirty tool that causes scratches on the product surface. The operator should clean the tool regularly to minimize this problem. These causes are shown on control charts as trends or results that are outside control limits.
I recommend using the Nelson rules to identify special causes.
Normal causes
Such causes are "built-in" to a stable, repeatable process. It is a natural variability resulting from the operation of machinery, tools, variation in environmental conditions to a certain extent, etc. Those closest to the process have no control over this type of variability. Only actions at a higher level of management can improve it. Examples of actions: change tools to better quality, purchase more precise machines, change materials to more repeatable ones, implement better training and work methods, etc.
Purpose of the control chart
The main purpose of a control chart is to control the process, i.e., to be able to distinguish between normal process variation caused by normal causes and issues generated by special causes. In this way, those using the control chart know when they should regulate the process and when to remain mere observers.. and not change anything :)
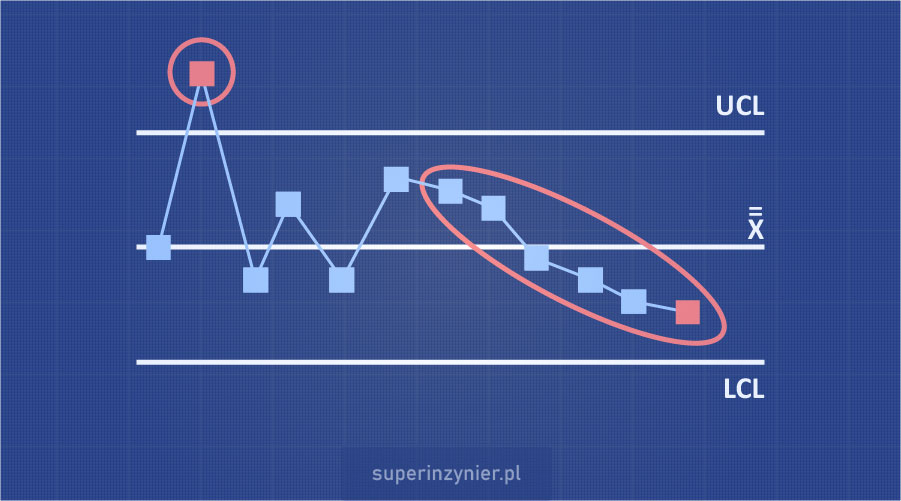
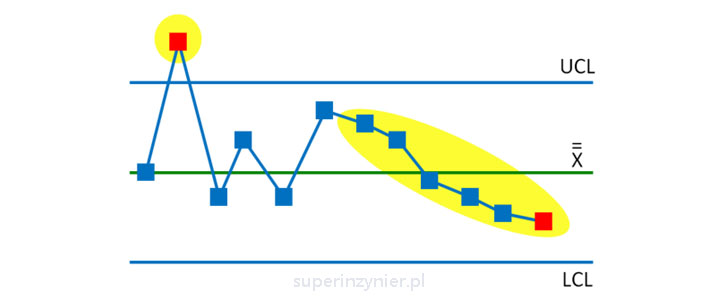
The figure below shows part of the control chart (the so-called "X track" of the X-R chart). As you can see, the graph shows the performance of the process with some variation. With the control chart and its test rules, we can see two distortions caused by a special cause. These two distortions should be removed, and the others should not be responded to. The first problem is exceeding the upper control limit (UCL), and the second is the appearance of a trend (such as tool wear).
Control chart implementation
The implementation of the control chart requires several steps:
- Process selection. Select a process where the implementation of a control chart is highly desirable. For example, an operation where a special product characteristic or other feature is produced, the variability of which can generate high losses.
- Characteristics. The characteristic to be measured should be clearly defined. This can be, for example, length, weight, voltage, current, duration, number of errors, etc.
- Sampling. Determine how many samples will be taken in each series of measurements (sample size) and how often these samples will be taken (e.g., every hour, every shift).
- Type of control chart. Depending on the type of characteristics to be measured and the sampling rules, select the appropriate type of control chart.
- Data collection. Depending on the selected control chart, a certain minimum number of measurements will be required to correctly calculate control limits. This data should be collected from a process that is not disturbed by special causes - this is very important. It is also necessary to make sure that the variation in the measurement system is small enough to allow reliable analysis of the results. For this purpose, it is useful to use a method known as: Measurement Systems Analysis (MSA).
- Control Limits. Calculate control limits commonly referred to as LCL (Lower Control Limit) and UCL (Upper Control Limit). Before calculating the limits, make sure that the process under study is statistically stable. If the process is unstable then remove the special causes and only then calculate the control limits.
- Run the chart. Entering regular measurements and recording the results in the control chart. The rules for calculating points on the card depend on the type of control card in use.
- Process control. Analyze the results on the control chart and take action when there is a special cause. This situation is in most cases exceeding control limits or visible trends. It is worth mentioning that several tests have been developed to detect the occurrence of a special cause.
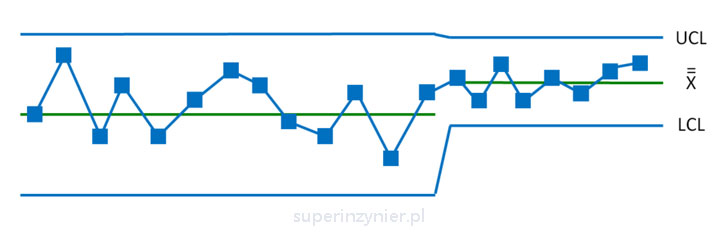
- Continuous improvement. A process can be improved and monitored at the same time using a control chart. By investing in the right equipment, procedures and training, the variability of the process can be reduced, or the process average can be moved in the desired direction. Then recalculate the control limits to monitor the improved process. The figure below illustrates this improvement idea:
Advantages
- It helps detect the occurrence of a special cause, so that adjustment in the process can be undertaken only in justified cases. This reduces costs and improves quality.
- Facilitates process improvement. The card's control limits can be recalculated after improvements are made, thereby establishing a new, higher level of quality.
- A good tool for monitoring some special characteristics.
- The control chart is very helpful during problem solving like 8D Method or Global 8D Method.
Disadvantages
- Not suitable for unstable processes, as there are difficulties in calculating control limits.
- Monitoring very high-capability (highly repeatable) processes can be difficult, as a suitable measurement system will be costly or difficult to apply.
Summary
With a control chart, you can control the process based on the data and take appropriate action when it is actually required.
A control chart makes the most sense when it is used "on-line" by people who can spot a problem based on it and take action immediately, or possibly spot a trend and schedule action at a convenient time.
Implementing a control chart can be a lengthy process that requires staff commitment and a systematic approach. However, it can yield significant benefits in terms of quality improvement and cost reduction.
