 Polski
 English
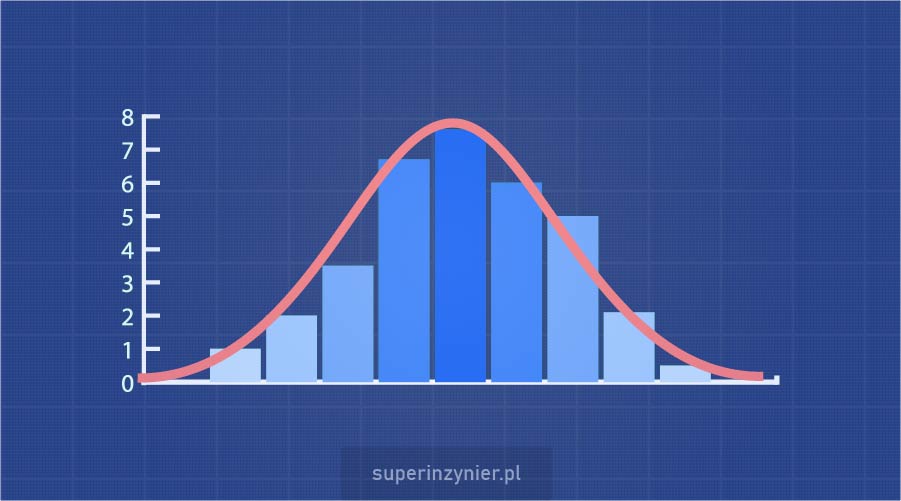
What is a histogram?
A histogram is one of the seven basic quality tools, widely used in statistics, and is a part of a broader concept called Statistical Process Control (SPC).
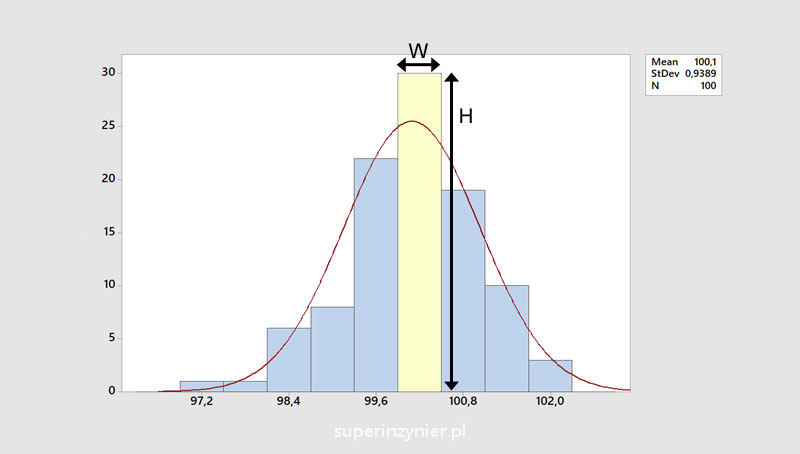
A histogram represents the distribution of a characteristic under study (for example, the width of a product) in the form of a bar graph. The width of a given bar (W) represents a certain range of values, while the height of the bar (H) represents the number of times the characteristic's value falls within that range.
The following figure shows an example of a histogram:
How to prepare a histogram?
Data collection
- At least 50 measurements should be collected so that the histogram can fairly well represent the studied characteristic of the entire population. Of course, the more measurements collected, the more similar the histogram will be to the population under study, so I recommend taking more samples.
- If possible, samples should be taken randomly.
- Make sure the measurement method is correct.
Range
We calculate the range for the entire sample taken (all results). The range is the result of subtracting the smallest value from the sample from the largest value.
Number of bins
We determine the number of bins required. This is not an easy task, because there is no single way to determine it. Many different methods are used. For example:
- The number of bins (k) is the square root of the number of observations rounded to the nearest integer.

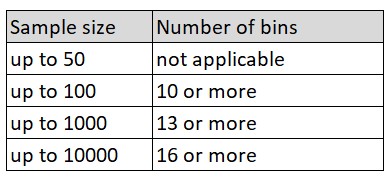
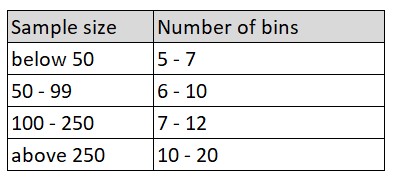
- The second solution is to break down according to DIN 55302, using the following table:
- Prof. Kaoru Ishikawa recommended [1] following:
- CNOMO Norm E41.32.110N (PSA) recommends the following:
- Mathematical formulas by: Rice, Doane, Scott, Freedman-Diaconis, Shimazaki and Shinomoto.
- Other
Using wider bins, reduces histogram sensitivity to sampling variability. Using narrower bins, increases this sensitivity. If the number of bins is significantly different from the recommendations, then displayed shape of the histogram may be affected.
Width of a bin
We calculate the width of the bin (W) based on the following formula

Where k is the previously calculated number of bins and R is the previously calculated range.
The width of the bin (W) should be rounded up to the same decimal place as the collected measurement data.
Range of bins
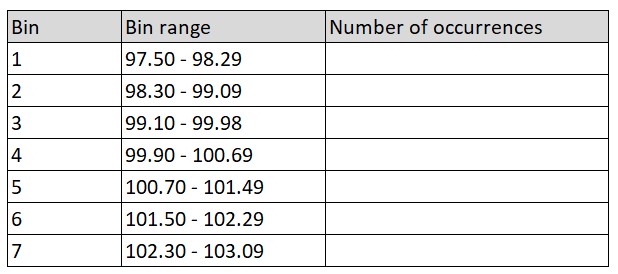
We can define the lower limit for the first bin as the minimum value from the measurement data. Its upper limit is the beginning of the next bin. We determine the next bin by adding together the widths of the bins (W). It is important to remember that the bins are mutually exclusive, in other words, observations that are "on the border of the bin" can belong to only one of them.
The following table gives an example of the individual ranges for k=7, w=0.8 and the smallest value in observations = 97.5.
Number of occurrences
We then assign the results of the measurements (observations) to each bin. We mark each result with one vertical line in the column "Number of occurrences"
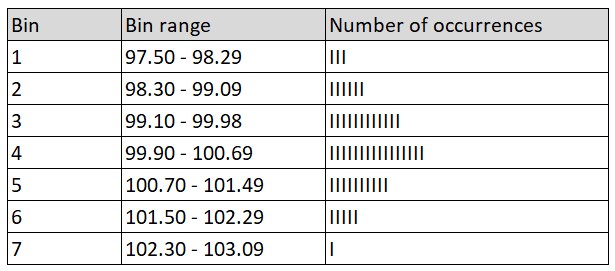
This is how we developed the histogram.
Histogram analysis
Mean
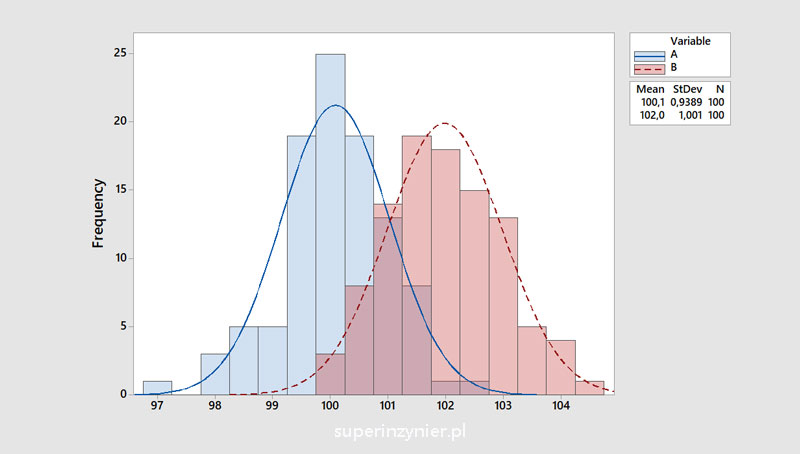
Mean allows us to estimate where the center of the analyzed set of observations is. This allows us to better understand what the mean value of a characteristic is and possibly compare it with the mean in other histograms with similar or slightly different variability. The chart below shows two histograms with the same number of observations (100), similar variability, but with a different mean. For graph A, the average is 100.1; while for graph B, the average is 102.0
Variation
The width of the histogram reflects the degree of variation of the characteristic under study. The wider the histogram, the greater the variation; the narrower the histogram, the smaller the variation. Variation is most often described by the standard deviation, denoted by the letter s or σ (Greek letter sigma). Sometimes the designation StDev (standard deviation) is also used. The larger the standard deviation, the greater the variation of a characteristic.
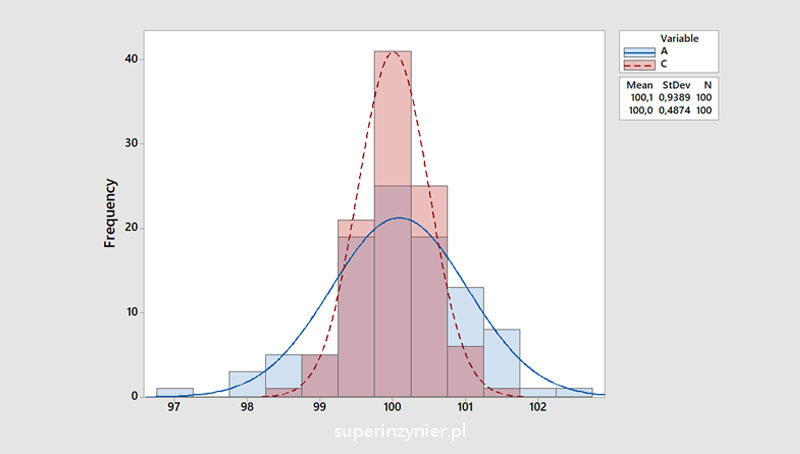
The following graph shows two histograms with the same number of observations and mean, but with different variation. Graph A is wider than graph C. The standard deviation for A is σ = 0.9389 while graph C has a standard deviation of σ = 0.4874.
Shape
Before evaluating the shape of the histogram, it is important to make sure whether the characteristic under study should have a normal or non-normal distribution. This should be kept in mind in order to draw correct conclusions.
If the characteristic should have a normal distribution and yet the histogram does not indicate this, then we are dealing with a distortion. This distortion is referred to as "special cause". The histogram allows us to detect such abnormalities, by analyzing the shape of the graph.
Normal distribution has a shape resembling a bell or a mountain with a single peak with two similarly angled slopes.
Skewed distribution. This is an asymmetric distribution because there are some factors (natural or disturbance) that limit the number of observations below (or above) a certain value. Depending on the limiting or disturbing factor, such a graph can be right-skewed or left-skewed.
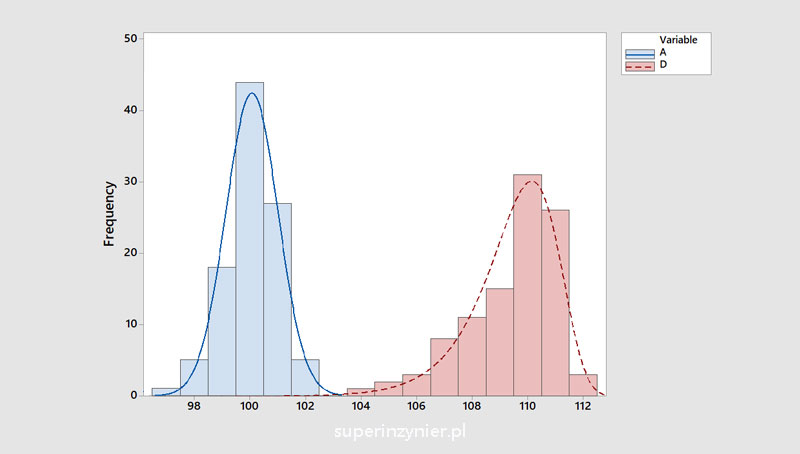
Left skewed distribution (D) compared to normal distribution (A):
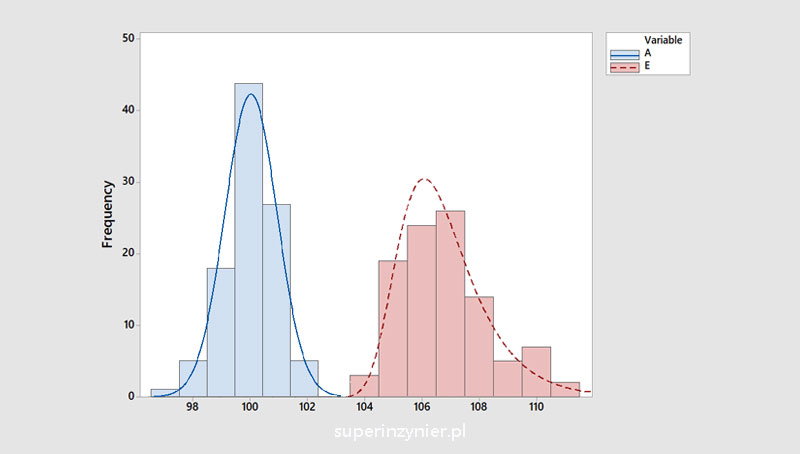
Right skewed distribution (E) compared to normal distribution (A):
The histogram may also have an irregular shape or several peaks. This may indicate the presence of a special cause in the process. We may also have to deal with data taken from different populations, in which case we observe overlapping histograms.
Summary
With a histogram, it is easier to understand what the analyzed process looks like and the average, variability and shape of the analyzed data. By comparing the histogram with the specification limits, we can make a preliminary assessment of whether the process/product meets the requirements. The histogram is very helpful during problem solving like 8D Method or Global 8D Method.
Finally, I would like to point out a few things:
- The histogram, like any other statistical tool, can also be misused. Changing the number of bins or their width can sometimes change the shape of the graph. Therefore, it is important to pay attention to how many measurements we have (n) and how many bins there are (k) when analyzing a histogram.
- A histogram will only reflect reality if the data is up-to-date and collected in the right way (using the right measurement method). If the data to be analyzed is a sample from a larger population, it is also important to make sure it was taken at random.
- It's a good idea to use good software to develop the histogram so that you don't waste time on calculations and, more importantly, don't make mistakes in calculations that can result in wrong decisions later.
The histogram can also serve as an effective tool for communication or business decision-making, especially for large amounts of data that are difficult to present in any other form.
References
- Kaoru Ishikawa "Guide to Quality Control", Asian Productivity Organization, Tokyo, 1976
- E.Dietrich, A.Schulze "Metody Statystyczne w kwalifikacji środków pomiarowych maszyn i procesów produkcyjnych" Issue 1, Notika System, 2000
