 Polski
 English
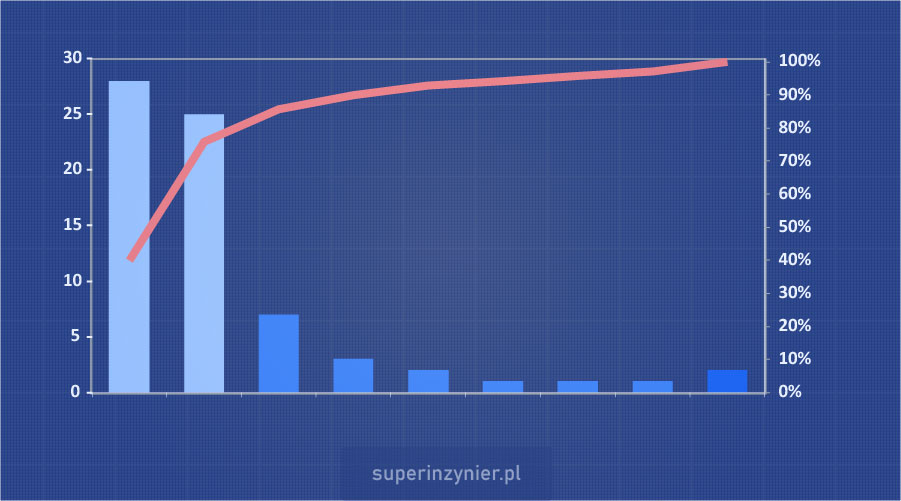
Pareto Diagram
Also referred to as: Pareto Chart, Pareto-Lorenz Diagram, Pareto Analysis or the 80/20 Principle, it is one of the seven basic quality tools.
A Pareto diagram is a chart that makes it easy to distinguish the factors of the greatest importance from others that are slightly less important. It allows focusing efforts on a few key factors to achieve the best results.
Pareto principle
Joseph Moses Juran, an American quality management legend, described the principle of "vital few and trivial many" in his book Quality Control Handbook. As an example of this principle, he referred to an observation made by Vilfredo Pareto (15.07.1848 - 19.08.1923), an Italian sociologist, economist and philosopher, who, analyzing the distribution of income in Italian society, found that 80% of the country's wealth was owned by 20% of the population. Influenced by the publication of the "Quality Control Handbook", this principle was popularized as the "Pareto Principle", which was not quite Juran's own intention [1].
The Pareto principle, sometimes referred to as the 80/20 rule, works perfectly in virtually every area of life. For example:
- about 80% of defects are the result of 20% of causes
- about 80% of customers buy 20% of goods
- about 80% of the profit comes from 20% of the customers
- about 80% of the manufacturing costs come from 20% of the processes
- about 80% of the total sales value is the result of selling 20% of the product types
- about 80% of complaints come from 20% of customers
Pareto diagram layout
A Pareto diagram consists of two series of data presented on a single graph.
The first series consists of a certain number of bars ordered from largest to smallest (in blue in the example below). Each bar represents a specific category of data, and the height of the bar reflects the number of results within each category.
If there are a large number of categories, some of them, those with a small number of results, can be added together and plotted on the chart as the last bar under the name "others". This reduces the amount of information on the chart and therefore improves its readability.
The second series (line in black) shows the cumulative percentage of results. The sum of all results equals 100%. The Y axis for this series is on the right. This allows you to see which categories account for about 80% of the results.
An example of a Pareto Diagram is shown below.
Pareto analysis
First, we check whether the chart displays the pareto principle (80/20 rule).
The following example shows the results of quality control of a batch of manufactured devices. The categories are the types of defects, and the values are the number of nonconforming items. The first two categories of the available ten account for about 75% of all defects.
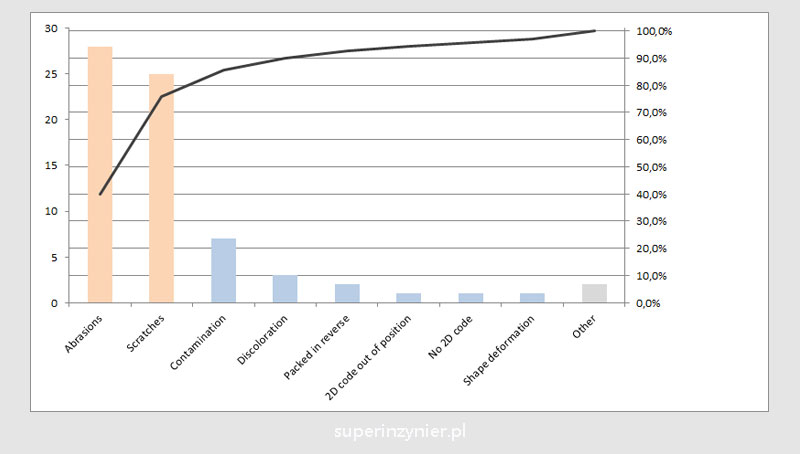
As we can see from the chart above, abrasions and scratches (the first two categories), account for the vast majority of defects (75%). If we now identify the causes of the defects and remove them, the vast majority of problems will be solved. Thanks to Pareto analysis, we know what should be a priority in our efforts.
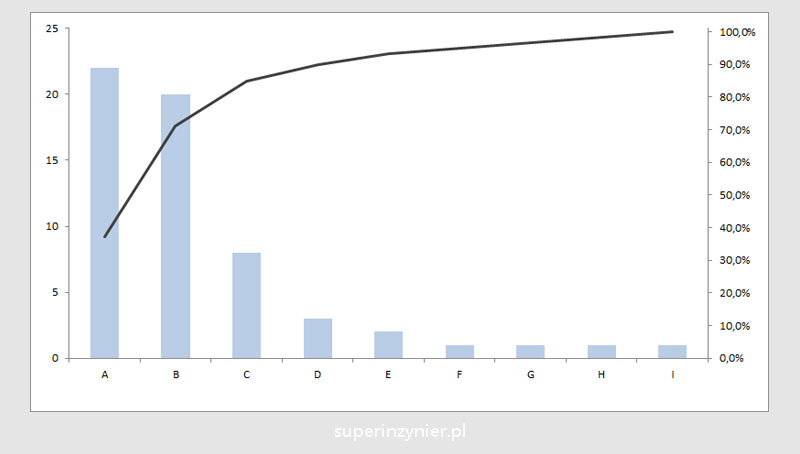
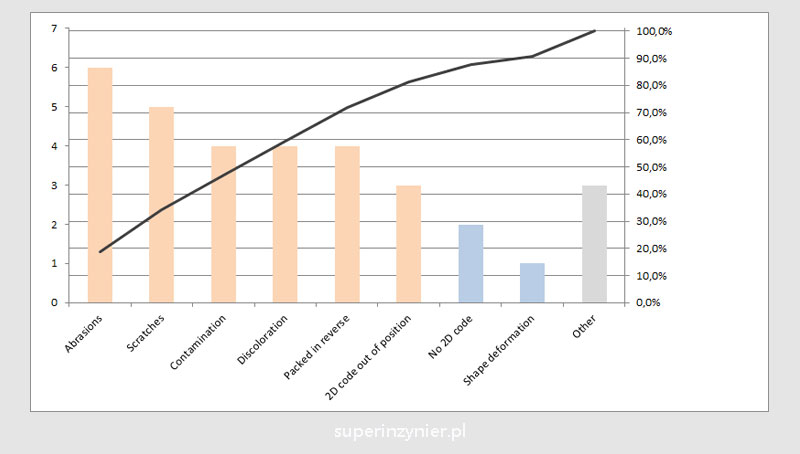
The chart below shows a situation where the 80/20 rule is not evident. In this case, six categories (about 65% of the factors) account for about 80% of the results, so here we have an 80/65 relationship ;).
If the 80/20 rule is not evident, it may be related to the following issues:
- Too many categories with similar meaning were created. In such a situation, consider combining several categories with each other. For example: "scratches" and "surface cracks" can be combined into "scratches".
- The division into categories is unclear. For example, the categories " housing defects" and "surface defects" may be unclear when the defect is "damaged housing surface". In such a situation, someone may categorize such a defect differently, breaking down the number of occurrences into two categories.
- Too few results to see the dominant category.
- That's just the way it is. We may actually have a situation where the 80/20 rule is not obvious.
Application
The Pareto principle (80/20 rule) is crucial in quality management, because very often we have a situation where about 80% of nonconformities are the result of about 20% of causes. If we focus on solving these 20% of causes, we will reduce the level of nonconformities by about 80%. We can check whether we are actually dealing with the 80/20 rule, and if so, we can determine which 20% of the causes are responsible for 80% of the problems.
Among other things, Pareto analysis can be used to:
- Describe the problem to better understand the impact of the various factors on the phenomenon under analysis.
- Select major categories (factors) for further analysis or improvement.
- Verify the effectiveness of corrective actions by performing another Pareto analysis after implementing the actions, e.g., as part of 8D.
Summary
The Pareto diagram is one of the seven basic quality tools. Its use in quality improvement is highly recommended, as it allows you to focus on the factors that have the greatest impact on the analyzed results.
By analyzing the Pareto diagram, we can see that the 80/20 rule does not occur exactly in these proportions. Sometimes there is a 70/30 or 90/10 relationship, and we should not be particularly concerned about this. The important thing is that with this analysis we can identify the important categories that affect most of the results and not waste time on trivial (or rather, less important) topics. At the same time, it is important to remember that the remaining "trivial" categories cannot be ignored in the future, because one day they will become important categories..
References
- Joseph M. Juran, "The Non-Pareto Principle; Mea Culpa", 1974
