 Polski
 English
Introduction
In the industry, various indicators are used to assess the extent to which customer requirements are met. The indicators includes financial performance, delivery, efficiency, and quality. In the context of quality management, there is a wide range of such indicators, such as PPM, FTPY, or DPMO.
However, there is also a specific group of indicators focused on verifying whether a specyfic product or process characteristic meets customer requirements. In this context, the most commonly used indicators in quality engineering are:
- Pp, Ppk - process performance
- Cp Cpk - process capability
- Cm Cmk - machine capability
- Cg, Cgk - gauge capability
It is worth noting that indicators such as Pp, Ppk, Cp, Cpk, as well as Cm and Cmk, are part of the broader topic known as SPC (Statistical Process Control). Meanwhile, gauge capability indicators Cg and Cgk are associated with MSA (Measurement System Analysis).
The subject of this article is the process performance indicators Pp and Ppk.
Note: In February 2026, AIAG and VDA released the AIAG & VDA SPC Yellow Volume – this is a draft version, open for review and comment. This article covers Pp and Ppk indices as defined in guidance predating the AIAG & VDA SPC Yellow Volume.
Pp, Ppk - The Idea
Process performance indicators help to evaluate how a product or process characteristic falls within specification limits. So it is an assessment of the degree to which customer requirements are met.
The concept of Pp and Ppk indicators involves comparing customer requirements (specification, "the voice of the customer") with the so-called "process width" or "the voice of the process."
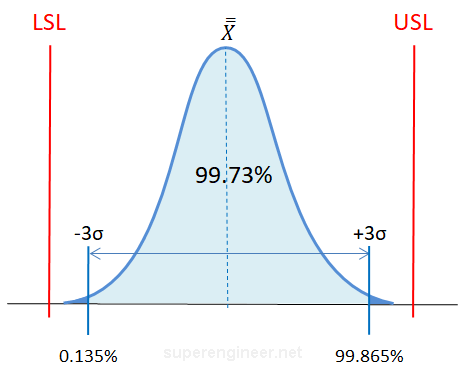
The figure below illustrates a process located within the specification limits marked by vertical red lines. LSL stands for Lower Specification Limit and USL stands for Upper Specyfication Limit. The "process width" are determined between the 0.135 and 99.865 percentiles, meaning that 99.73% of observations fall within this range (99.865 - 0.135 = 99.73).

If the process follows a normal distribution, then the 0.135 percentile corresponds to Xavg - 3σ, and the 99.865 percentile corresponds to Xavg + 3σ. Therefore, the typical process limits are considered to be ±3σ away from the process mean Xavg. In total, the process width is 6σ.
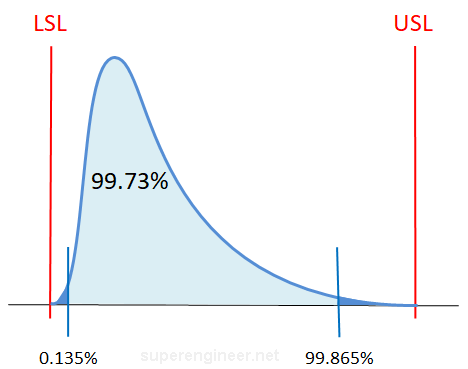
If the process distribution is non normal, then Ppk calulation based on Xavg ± 3σ will not incorrect. In such cases, alternative approaches should be used, such as the Co-Box transformation, Johnson transformation, percentile estimation, etc.
The most commonly used method is fitting a mathematical distribution model to the actual data. Then, values for the 0.135 and 99.865 percentiles are determined using the inverse cumulative distribution function (F-1) specific to the distribution type. These values define the "process limits" and are subsequently used to calculate Pp and Ppk indexes.
Currently, such calculations are typically performed using specialized statistical software. However, they can also be conducted in spreadsheets or by utilizing libraries in popular programming languages like Python, R, or JavaScript.
Pp, Ppk - Formulas
The formulas below are presented in the AIAG SPC manual[1]. These formulas are applicable to processes with a normal or near-normal distribution.
Pp
Pp is an indicator representing the potential process performance that could theoretically be achieved with perfect centering of the process relative to the specification limits. The formula for Pp:[1]
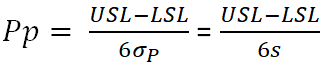
where:
- USL - Upper Specification Limit
- LSL - Lower Specification Limit
- σP, s - Standard Deviation
Ppk
Ppk is an indicator representing process performance considering the shift toward one of the specification limits. For this indicator, two separate calculations are performed, and the smaller result is selected. The formula for Ppk:[1]
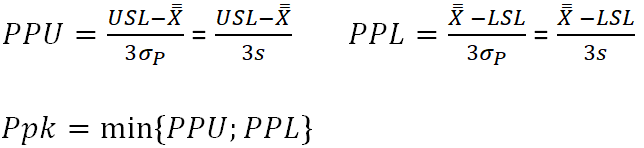
where:
- USL - Upper Specification Limit
- LSL - Lower Specification Limit
- X̄ - Process mean
- σP, s - Standard Deviation
Standard Deviation
The calculation of Pp and Ppk indicators involves the use of the standard deviation. This is an approximation of the actual value, calculated from all collected samples (Total Variation). Formula:[1]
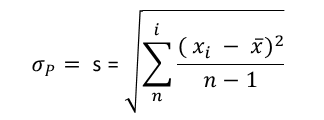
where:
- xi - Individual observation in the dataset
- x̄ - Arithmetic mean of all observations
- n - Total number of observations in the dataset
- i - Index (observation number)
Pp, Ppk - Interpretation
The interpretation of results depends on established guidelines. Commonly, customer-specific requirements are applied, or if absent, internal limits are set. Often, thresholds such as 1.67, 1.33, or 2.0 are used.
Example guidelines:
- Pp, Ppk ≥ 1.67: The process meets customer requirements.
- 1.00 ≤ Pp, Ppk < 1.67: The process requires improvement; acceptance depends on the customer.
- Pp, Ppk < 1.00: The process does not meet requirements.
Pp and Ppk indicators should be analyzed together, as their relationship indicates the possible direction for process improvement.
The animation below illustrates the relationship between Pp and Ppk when the process changes its position or variability:

Difference Between Pp, Ppk and Cp, Cpk
The difference between Pp and Ppk and Cp and Cpk lies in the calculation of standard deviation.
- Pp, Ppk use the standard deviation calculated from the overall process variability (overall variation), considering all sources of variability in the process. These indicators represent the actual, total variability of the process.
- Cp, Cpk use the standard deviation calculated using the estimator, based on subgroup ranges (within variation). This approach excludes long-term variability. Cp and Cpk measure the theoretical capability of the process, assuming process stability.
In summary:
- Pp, Ppk reflect how the process actually performs, accounting for total variability.
- Cp, Cpk indicate the process's potential capability, focusing only on within-subgroup variability.
- Pp ≤ Cp, Ppk ≤ Cpk: Pp, Ppk can not by higher than Cp, Cpk when calculated from the same dataset.
- Significant differences between Cp, Cpk and Pp, Ppk indicate disturbances in the process, such as special causes.
- Similar values for Cp, Cpk and Pp, Ppk suggest a statistically stable process with negligible special cause influence.
Pp, Ppk - Recommendations
Here are some tips, subjectively ;) chosen:
- The sample size matters. The larger the sample size, the more reliable the Pp and Ppk results, as the calculations will better approximate the actual population values. In this context, it is worth exploring the concept of a "Confidence Interval."
- Calculation depends on the type of distribution. The calculation of Pp and Ppk may rely on the process mean and standard deviation for processes with a normal or near-normal distribution. Otherwise, different rules should be applied, such as fitting a model to the data and determining percentiles.
- Do not confuse calculations with Cp and Cpk. This is a common mistake made by users applying unverified formulas in Excel.
- A capable measurement system. If the measurement system is not capable (has high variability), it can significantly worsen Pp and Ppk results. Therefore, the measurement system should be capable. For more information, see: MSA - What is Measurement System Analysis?
Standards
Pp and Ppk indicators are described in various industry standards and international norms. The main ones include:
- AIAG SPC, "Statistical Process Control (SPC)" Reference Manual
- ISO 22514 (series), "Statistical Methods in Process Management - Capability and Performance"
- AESQ AS13006, "Process Control Methods"
Summary
Process performance indicators Pp and Ppk are useful tools for assessing whether a characteristic meets customer requirements. Understanding these indicators and the principles of their correct calculation is a crucial aspect of an engineer's work.
Errors often arise when Pp and Ppk are calculated based on the normal distribution model, while the actual process follows a completely different distribution. Analyzing such results leads to incorrect conclusions and misunderstandings.
When using Pp and Ppk indicators, consider the number of measurements (the more, the better), the measurement system's capability (MSA), and the correctness of the formulas used.
Process performance should be regularly monitored, and improvement actions should be taken if the indicators decline.
Note: In February 2026, AIAG and VDA released the AIAG & VDA SPC Yellow Volume – this is a draft version, open for review and comment. This article covers Pp and Ppk indices as defined in guidance predating the AIAG & VDA SPC Yellow Volume.
References
- AIAG, Statistical Process Control (SPC) Reference Manual, 2nd ed. Southfield, MI: Automotive Industry Action Group, 2005.
