

Introduction
In quality engineering, several metrics are used to estimate the relationship between the variability of a process, machine, or measuring gauge and the customer requirements. These indicators include:
- Pp, Ppk - process performance
- Cp, Cpk - process capability
- Cm, Cmk - machine capability
- Cg, Cgk - gauge capability
Pp, Ppk, Cp, Cpk, Cm, and Cmk are part of the broader topic of SPC (Statistical Process Control), while the gauge capability indexes Cg, Cgk are related to MSA (Measurement System Analysis).
Note: In February 2026, AIAG and VDA released the AIAG & VDA SPC Yellow Volume - this is a draft version, open for review and comment. Among other changes, this handbook replaces Cm and Cmk with machine performance indices Pm and Pmk.
This article covers machine capability indices Cm and Cmk as defined in guidance predating the AIAG & VDA SPC Yellow Volume.
Enjoy the read.
Process Variability
Every production process is characterized by a certain degree of variability that affects the quality of the products. This variability is the result of numerous factors, such as:
- Material. Materials used in the process have their own variability in parameters like hardness, plasticity, and impact resistance. Variations in these parameters between batches can increase overall variability.
- Environment. Variability in environmental conditions, such as ambient temperature, humidity, vibrations, dust, or UV light exposure.
- Operator. In many cases, the process outcome depends on the operator's performance. This is especially significant when the operator is responsible for material alignment, cleaning the workspace, or other manual activities that can introduce variability. Another aspect is the precision of machine setup, which includes selecting optimal operating parameters and ensuring precise alignment of mechanical components and tool positions.
- Method. The method by which the process is executed can also be a source of variability. For example, the sequence of operations, the method of part alignment (manual or automatic), and the types of tools used.
- Measurement. The measurement system used in the process is also a source of variability. Measurement results are used to set up, monitor, and control the process. Variability from the measurement system adds to overall process variability. The better the measurement system, the less its impact on process variability.
- Machine. Variability directly associated with the machine's performance. Key factors include the precision of machine components, a robust design minimizing vibrations, positioning accuracy of moving parts, the quality of servomotors, the quality of linear or stepper motors, and optimal control algorithms, etc. Additionally, the wear and tear of components such as bearings, guides, and other movable elements is another factor contributing to increased variability.
In this context, machine-induced variability is viewed as one component of the total process variability. It can also be stated that a process cannot be more capable than the machine involved in it.
Cm, Cmk - The Concept
How can we estimate a machine's capability? After all, the machine operates in a variable environment, with different material batches, is set up by different people, and is operated by various operators.
The solution to this problem lies in the previous discussion. To estimate machine capability, we conduct a mini-experiment. We aim to isolate the machine's variability from the total process variability by minimizing other sources of variability.
Here's what can be minimized:
- Use only one batch of materials.
- Thoroughly clean and precisely set up the machine. The reverse order is not recommended :)
- Have the work performed by one experienced operator.
- Conduct the experiment during one shift to reduce environmental variability.
- Measure characteristics using a single, capable measurement system.
Produce 100 parts one after another—this is the preferred quantity[1]. Sometimes, technical constraints may require fewer parts, e.g., 50, with the absolute minimum being 30 if the process follows a normal distribution[1]. Certain standards require at least 50 parts[2].
The collected measurement results represent the machine's variability with a "minor contribution" from other factors we attempted to minimize earlier. The following animation illustrates this concept:

The next step is to check whether the collected results indicate a stable process. Commonly used tools include Run Charts, Histograms, or Control Charts.
If the process is stable, we then proceed to calculate Cm and Cmk metrics.
Cm, Cmk - Formulas
Cm and Cmk are calculated in the same way as the process performance metrics Pp and Ppk:
- For processes with a normal distribution, the "standard" formula is used, where process limits are understood as ±3σ from the process mean. The standard deviation is calculated as the "root" (total variation).
- For processes with a non-normal distribution, process limits are typically defined as the 0.135 and 99.865 percentiles, and the metrics are calculated accordingly.
Cm
The formula for normal distribution:

where:
- USL - Upper Specification Limit
- LSL - Lower Specification Limit
- σ - Standard deviation
Cmk
Cmk represents machine capability considering shifts toward one of the specification limits. For this metric, two separate calculations are performed, and the smaller result is taken. The formula for Cmk (for normal distribution):
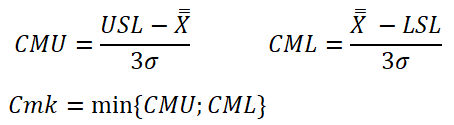
where:
- USL - Upper Specification Limit
- LSL - Lower Specification Limit
- X̄ - Process mean
- σ - Standard deviation
Standard Deviation
The standard deviation used to calculate Cm and Cmk is an approximation of the actual value, calculated from all collected samples (Total Variation). Formula:

where:
- xi - Individual observation in the dataset
- x̄ - Arithmetic mean of all observations
- n - Total number of observations in the dataset
- i - Index (observation number)
Cm, Cmk - Interpretation
The interpretation of results depends on the adopted standards. Typically, client requirements are followed, or in their absence, internal limits are established. Commonly used thresholds are 1.67, and sometimes 2.0.
Example rules:
- Cm, Cmk ≥ 1.67: The machine meets client requirements.
- Cm, Cmk < 1.67: The machine does not meet requirements.
Cm and Cmk should be analyzed together, as their relationship can indicate possible directions for process improvement.
Standards
Cm and Cmk are described in the following standards:
- ISO 22514 (series): "Statistical Methods in Process Management - Capability and Performance"
- VDA Volume 04 Section 3: Methods, Verband der Automobilindustrie, 2021
Conclusion
Machine capability indexes Cm and Cmk assess whether a machine in a given process is repeatable enough for the process to meet customer requirements. If machine capability is too low, the process will perform even worse.
It is also important to evaluate Cm and Cmk after relocating a machine, conducting significant repairs, or making major modifications, as these changes can negatively affect machine capability.
Note: In February 2026, AIAG and VDA released the AIAG & VDA SPC Yellow Volume – this is a draft version. In this handbook, Cm and Cmk have been replaced with machine performance indices Pm and Pmk.
References
- ISO 22514 Statistical methods in process management — Capability and performance, ISO, 2020
- VDA Volume 04 Section 3: Methods, Verband der Automobilindustrie, 2021.
