

Introduction
Many indicators are used in the manufacturing industry to assess the quality of processes. Commonly used include: process capability (Cp, Cpk), process performance (Pp Ppk), and machine capability (Cm Cmk). These indicators are based on similar formulas, with differences in sampling methods or standard deviation calculation.
Capability and performance indicators are associated with the SPC method. Additionally, it's worth noting that MSA analysis uses the Cg and Cgk indicators as part of Type I study.
Cp and Cpk help to estimate how well a process characteristic meets specification requirements.
This article presents the idea of process capability, useful formulas, result interpretation, and recommendations for proper use.
Note: In February 2026, AIAG and VDA released the AIAG & VDA SPC Yellow Volume - this is a draft version, open for review and comment. This article covers Cp and Cpk indices as defined in guidance predating the AIAG & VDA SPC Yellow Volume.
Process Capability - Idea
Process capability evaluates the degree to which a characteristic falls within specification limits. It compares the process's "boundaries" to the specification limits, helping determine whether the process meets specified requirements.
It is generally accepted that these process "boundaries" cover 99.73% of results. For a normal distribution, it corresponds to the results within ±3 standard deviations (σ) from the mean (X).

The intention of Cp and Cpk indicators is to determine whether the process is capable of meeting customer requirements.[1]
Cp, Cpk - Formulas
The formulas below are the most commonly used in the industry and are described in the AIAG SPC reference manual[1]. These formulas are applicable to statistically stable processes with a normal or near-normal distribution.
For processes with distributions significantly different from normal, calculating Cp and Cpk using these formulas will not be accurate. Alternative methods should be applied, which are beyond the scope of this article.
Cp
Cp is an indicator of the potential process capability, which could theoretically be achieved if the process is perfectly centered relative to the specification limits. The formula for Cp:[1]

where:
- USL - Upper Specification Limit
- LSL - Lower Specification Limit
- σ - Standard deviation estimator, calculated from the average range (R) divided by the constant d2, which depends on the subgroup size (n).
Cpk
Cpk is an indicator of process capability considering shift towards one of the specification limits. Two separate calculations are performed, and the smaller result is selected. The formula for Cpk:[1]

where:
- USL - Upper Specification Limit
- LSL - Lower Specification Limit
- X̄ - Process mean
- σ - Standard deviation estimator, calculated from the average range (R) divided by the constant d2, which depends on the subgroup size (n).
Standard Deviation
To calculate Cp and Cpk, a standard deviation estimator is used, a value derived from measured samples, approximating the true population standard deviation. Several estimators are available. The most common one is:
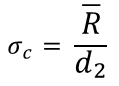
where:
- R - Average range
- d2 - Statistical constant dependent on subgroup size (n).
Cp, Cpk - Interpretation
The interpretation of results depends on established requirements. Specific client requirements are applied, or in their absence, one of the selected industry standards is used. The criteria depend on the client, industry, and in-house procedures. Commonly used thresholds are 1.67, sometimes 1.33 or 2.0.
Example criteria:
- Cp,Cpk ≥ 1.67: The process meets customer requirements.
- 1.00 ≤ Cp,Cpk < 1.67: The process requires improvement; acceptance depends on the client.
- Cp,Cpk < 1.00: The process does not meet requirements.
Both Cp and Cpk should be analyzed together, as their relationship indicates potential areas for process improvement.
The following animation shows the relationship between Cp and Cpk when the process changes its position or its variation:

Cp, Cpk - Recommendations
The following is a subjective list :) of important aspects for proper Cp and Cpk use:
- Sample size matters. The more samples collected, the closer the standard deviation and process mean will approximate true population values. Familiarizing yourself with "confidence intervals" can be helpful.
- The process must be statistically stable. Analyzing an unstable process is meaningless. The results will be incorrect and irrelevant.
- What is the distribution?. The presented above formulas for Cp and Cpk assume a normal process distribution. If the characteristic deviates significantly from normal distribution then the Cp and Cpk calculations will be inaccurate. There are methods for non-normal distributions handling, but are beyond this article's scope.
- Don't confuse Cp and Cpk with Pp and Ppk. This is a common mistake when using unverified Excel formulas, leading to incorrect standard deviation calculations and deriving Pp and Ppk instead.
- Capable measurement system. An incapable measurement system (high variability) can significantly distort Cp and Cpk results. Ensure the measurement system is capable. More details can be found in the article: MSA - Introduction to Measurement Systems Analysis.
Standards
The following standards provide formulas and guidelines for Cp and Cpk indicators:
- AIAG SPC. "Statistical Process Control (SPC)" Reference Manual
- ISO 22514 (series). "Statistical Methods in Process Management - Capability and Performance"
- AESQ AS13006. "Process Control Methods"
Summary
Cp and Cpk process capability indicators assess whether a process has the potential to meet customer requirements. Evaluation criteria should be based on client-agreed requirements.
Accurate results depend on verifying that the data satisfies minimum conditions: sufficient sample size, process stability, type of distribution, and an acceptable level of measurement system variation.
In this context, problems may arise. It happens that engineers attempt to calculate Cp and Cpk indicators based on a trial batch consisting of only a few units, or the process is not yet statistically stable, and the MSA analysis will be conducted "later".
Using a small number of samples, relying on data from an unstable process, or employing a measurement system with high or unknown variation when calculating Cp and Cpk can result in inaccurate outcomes.
Therefore, it is important to ensure that all conditions are met before calculating the Cp and Cpk. A proper approach to process capability analysis minimizes the risk of incorrect conclusions and helps build trust effective cooperation with customers.
Note: In February 2026, AIAG and VDA released the AIAG & VDA SPC Yellow Volume - this is a draft version, open for review and comment. This article covers Cp and Cpk indices as defined in guidance predating the AIAG & VDA SPC Yellow Volume.
References
- AIAG, Statistical Process Control (SPC) Reference Manual, 2nd ed. Southfield, MI: Automotive Industry Action Group, 2005.
