Ishikawa diagram
The work of an engineer very often involves solving various problems. As part of this, it is necessary to identify its cause and then fix it. Unfortunately, this is not always so easy.
Often, when we try to solve a problem, we see a potential cause that we automatically think is 100% certain. We may then close ourselves off to other possible causes because we think that what we have identified is the only valid option, after all, it's our own idea, and "we have a sharp eye", "years of experience", "intuition" and generally "we are the best".
Sometimes we find that after removing this "100% certain cause" the problem persists. This suggests that its cause must be something else and that our "100% certain cause" was not the only possible option.
In such situations, an Ishikawa diagram comes to the rescue.
This diagram is one of the seven basic quality tools, also known as: cause and effect diagram, fish diagram, fish-bone diagram.
The purpose of this diagram is to help you systematically identify possible causes of a problem. It can be used to organize brainstorming sessions, and allows you to sort ideas into useful categories. It can also be said that it somewhat "forces us" to take a broader look at the possible causes of a problem.
History
The Ishikawa Diagram was developed in the first half of the 20th century. Different publications give different dates.
Personally, I consider the information given in "Guide to Quality Control (1976)", which is based on the first English-language translation in 1971 of Kaoru Ishikawa's original publication "Genba no QC Shuho", to be the most likely. The Ishikawa diagram was first used in 1943 by Kaoru Ishikawa at Kawasaki Steel Works as a tool to help solve problems in the factory.[1]
In the years that followed, the tool became a popular method of identifying the causes of problems in the industry.
Preparation of the diagram
- Team. The team should be relevant to the topic. For production problems, I suggest including an operator with experience or someone from quality inspection.
- Time. The team must have enough time to do a good analysis. So: do not hold a meeting on Friday afternoon ;)
- Problem description. The process of determining the problem consists of a thorough and technical description of the issue in question and then placing this description on the right side of the chart. The problem description should be precise and emotionally free, avoiding terms such as "dangerous", "threatening" or "irresponsible". In some cases, you should also consider adding pictures to better illustrate the issue and facilitate understanding of the topic.

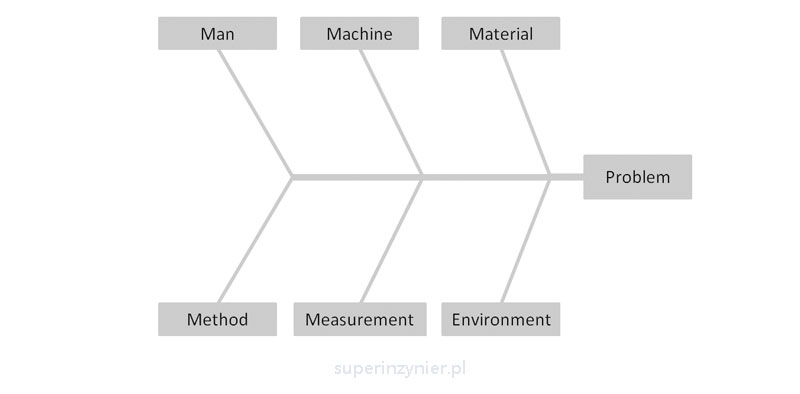
- Identification of main categories of causes. In a production environment, the so-called 5M+E can be used:
- Man.
- Machine.
- Material.
- Method.
- Measurement or Management.
- Environment.
 Other categories can be used according to the needs or requirements of the organization.
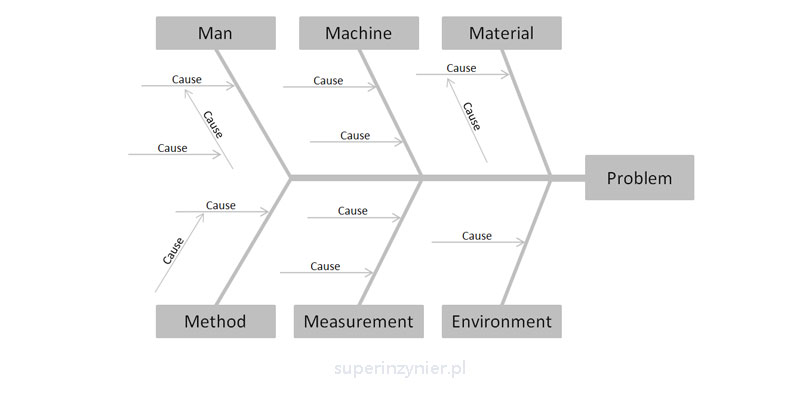
 - Identification of causes. We use brainstorming, which involves group discussion and assigning possible causes of the problem to appropriate categories. If it turns out that a given cause is the result of other causes, we represent such a relationship on a chart as " a cause of a cause". For this we use appropriately arranged arrows (or lines) showing the relationship between causes. With this approach, we are able to visually represent various cause-and-effect relationships.
 During brainstorming, it is advisable to avoid criticism of other ideas, for example, in the form of reactions such as "eee... nooo, this is stupid". Such an approach, instead of motivating the team, may limit the amount of ideas generated.
 - Final review. Once ideas about possible causes have been exhausted, it is advisable to focus on those categories where causes have not yet been identified or are very limited in number. It is worth considering if there are additional aspects or factors that can still be added to the analysis.
Example of an Ishikawa diagram
The following example shows an Ishikawa diagram for the problem of "cold solder joint" in the hand soldering process:

Disclaimer: The above example includes a portion of the possible causes of cold solder joint in hand soldering, but this is sufficient for the purposes of this article.
Why fishbone?
The appearance of an Ishikawa diagram resembles a fishbone to some people, so sometimes you encounter names such as "fish diagram" or just "fishbone diagram".

Advantages
- Helps identify causes related to different categories (e.g., 5M+E).
- Supports P-FMEA analysis. We have the potential type of defect and the potential causes of the defect.
- Supports problem solving through various methods, e.g. A3, 8D, etc.
- A good form of communication with a customer or supplier.
- Supports the team's brainstorming work
Disadvantages
- The Ishikawa diagram can become unreadable for more complex problems. Often there is a situation where too much information is "packed" next to the arrows, making it difficult to read.
- Time-consuming group discussions on assigning a given cause of a problem to the appropriate category. There may be a situation where the cause seems to "fit" into two different categories at the same time, such as method and man.
- Drawing an Ishikawa diagram in some programs, such as a spreadsheet or a word processor, can be time-consuming. The process of drawing lines and laying out text can often get in the way, and the team may focus on technical details, such as the positioning of arrows, instead of concentrating on the merit of the discussion. In the 1950s, when computers were not yet widely available, this chart format made sense because it could be created on a blackboard using chalk or on a piece of paper using a pencil. However, nowadays, using a spreadsheet, you can use a simple table and expand it dynamically, allowing you to add more causes much faster. Of course, this is my personal opinion, which may not necessarily be shared by others :)
Summary
An Ishikawa diagram is an extremely useful tool for identifying possible causes of a problem. It enables a more comprehensive and systematic view of the problem and a more streamlined solution.
The use of the Ishikawa diagram is widely used in conducting corrective actions, for example, within the framework of methods such as 8D, 3A. This tool is also useful during P-FMEA analysis, so it is worth using in the work of any engineer.
References
- Kaoru Ishikawa "Guide to Quality Control", Asian Productivity Organization, Tokyo, 1976


