Process flowchart
A process flowchart is one of the basic seven quality tools, also known as: process map, process diagram, process flow map.
A process flowchart is a graphical representation of a sequence of steps or operations that make up a specific process. It is a visualization tool that helps to understand, analyze and improve processes to ensure high quality products or services. A process flowchart is an important tool in an engineer's work. It helps in documenting procedures and instructions, in PFMEA analysis, in identifying and eliminating errors, in VSM (Value Stream Mapping) method and many others.
Preparation of the flowchart
The appearance of a process flowchart in most cases is not imposed by any standards or norms, so we encounter different forms, symbols and different details level in such documents. The development of a process flowchart requires the establishment of some basic rules, such as scope, level of detail, symbols and the required format.
Scope
Scope is the beginning and end of a process flowchart. For example, the beginning of the process is the first operation in the assembly line, and the end is the packaging of finished products.
Details level
When developing a process flowchart, there will be dilemmas related to the details level in the diagram. In this regard, it is necessary to determine:
- What do we mean by "process step"? Is a process step an entire activity at a given station, such as "20. Casting", or is it a smaller operation, such as "20.10 Metal injection", then next is "20.20 Extraction from mold", then next one is "20.30 Cooling"? Following is an example of two levels of detail:

- Is transport between operations a separate process step, or will it be an activity performed as part of a process step?
- Should rework, repair or scrapping be included?
Symbols
The creation of a process flowchart is based on the use of specific symbols that represent different types of process steps. The different symbols are connected to each other by arrows.
ISO 5807 symbols
Symbols developed under ISO 5807 are now very popular, as they are available, among other things, in the spreadsheets of many office suites. The most commonly used symbols:


ASME symbols
The ASME (American Society of Mechanical Engineers) developed a standard in 1947 titled "Operation and Flow Process Charts". This document contains rules for developing a process flowcharts, where the following symbols are used:


ASME has ensured that symbols are unambiguous, are to be used in one orientation only (do not rotate symbols), and should be easy to draw by hand even for "poor writers" [1]. ASME has defined a number of other rules related to the creation of flowcharts (e.g., combining several diagrams, grammatical form of the names of operations, material entering the process, etc.), but most of them are no longer in use.
We can find ASME symbols in forms used by organizations in the US or other companies affiliated with industries in the US. ASME symbols are also found in the automotive industry.
Example of a diagram
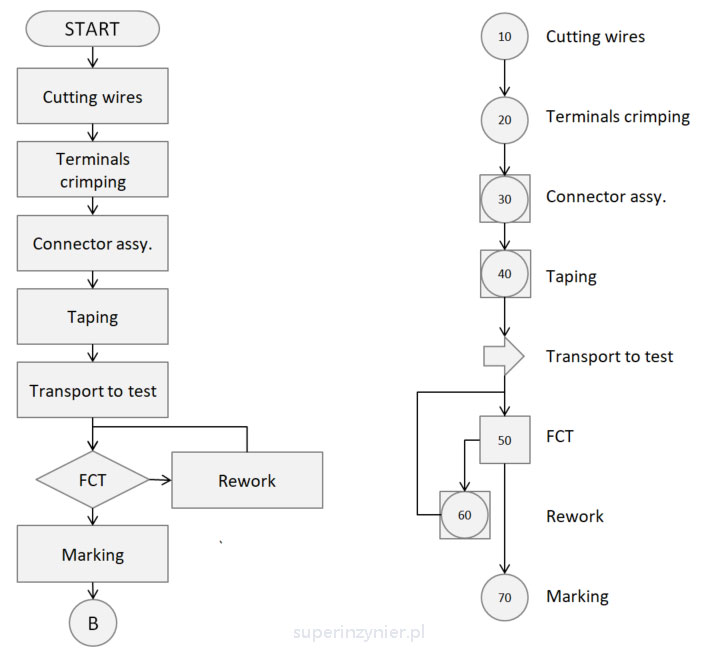
An example of a process flowchart using ISO 5807 (left) and ASME (right) symbols:

Flowchart advantages
Process flow charts offer many advantages:
- Clarity and understanding. Clear visualization to facilitate communication with stakeholders.
- Identify sources of failures. Help detect potential quality problems in the process.
- Required tool as part of APQP (Advanced Product Quality Planning) in the form of "Process Flow Diagram".
- Process documentation. Enables tracking of process history, quality decision points, etc.
- Often used as part of problem solving, e.g., the 8D Method.
- and many others..
Summary
A process flow chart is one of the most important tools in quality management and engineering work. It facilitates the visualization, analysis and improvement of processes, which leads to higher quality products and services. Engineers should use process flow charts as an essential tool in their work to improve the quality of processes, that is, ultimately to improve the quality of products and services
When developing a process flow chart, make sure what the scope will be (the beginning and end of the diagram), the level of detail, the required symbols, and the document format.
Many tools can be used to draw diagrams: a sheet of paper, a common spreadsheet software or a dedicated application. Personally, I usually use a common spreadsheet software + a bit of experience in quickly arranging objects..
References
- ASME Standard "Operation and flow process charts", ASME, 1947


